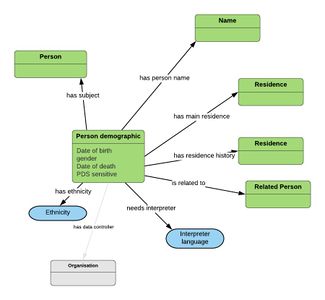
GRAPH VIEW OF DM
Jump to navigation
Jump to search
User has entered 'person' and selected person demographic from the list.
Tree displays person demographic in the ontology. The person demographic is centred.
The lower panels are perhaps collapsed initially but expanded where necessary?
Data properties are shown in the entity. Object properties are show as relationships to blue entities so the user could select these and go to the ontology page for that value set or class.
Data model relationships to other DM entities point to green boxes
| [Perso ] (Q)
Identifiable entity Health Event
|
Showing person demographic | |
| Filters
|
Data model Properties
|
1:1 Date of birth : Date 1:1 has person name : name 0: 1 Date of death : Date 1:1 has gender : Administrative gender 0:1 needs interpreter: interpreter language 01: has ethnicity |
| Data model Relationships | Has subject :Person Has main residence : Residence Has residence history : Residence Is related to :Related person Inherited Has data controller : Organisation | |
| Definitional axioms | A person demographic is Subclass of State entry | |
