DDS-UI dashboards
This section explains the internal dashboards used to monitor data flows in to and out of DDS. The dashboards have been built into an application called DDS-UI which, in addition to the dashboards, provides many back-end DDS management utilities, such as those for setting up new publisher feeds.
Included
The DDS-UI dashboards monitor the majority of DDS components that are responsible for the processing of published data, transforming raw data into the standardised FHIR-based intermediary model, and then transforming again for the individual subscriber databases. The dashboards cover almost every element of this data flow, although there are currently some exceptions to this, explained in the Exceptions section.
Not included
This section does not include:
- Slack alerts that report progress or to raise alerts about errors or failures; in many cases these alerts are simply to draw attention to an issue that the DDS-UI dashboards will display.
- Any aspect of hardware or infrastructure; these metrics are separately captured and monitored by the infrastructure team who have their own configured alerts to detect issues.
- Other applications that form part of the DDS, such as Data Sharing Manager or User Manager.
Overview
The DDS is made up of a large number of applications, running on many individual servers, interacting with many databases, all with different purposes. Due to this wide range of components, multiple dashboards have been implemented, to each monitor a specific part of the DDS.
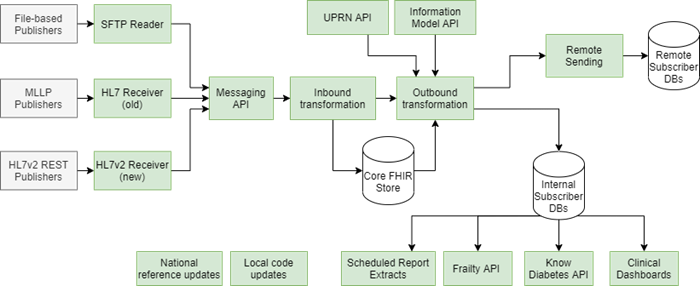
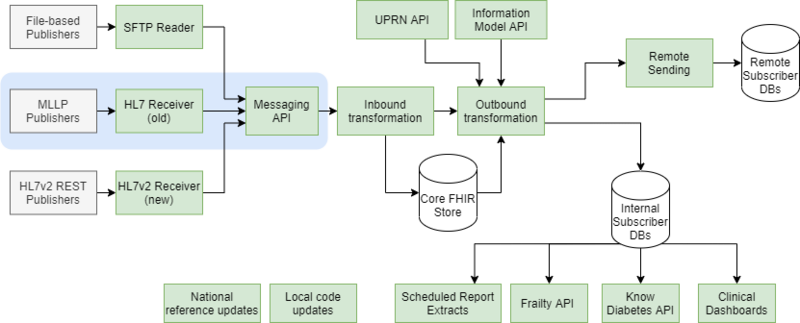
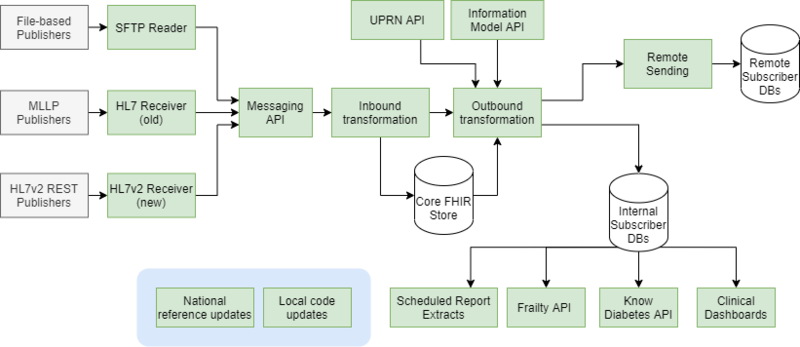
This diagram shows a high-level component-based diagram of the DDS (only including components related to the processing of data).
Each box represents one or more instances of an application, API or process.
Some of the major DDS databases are also shown.
| Component | Description |
|---|---|
| File-based Publishers | Represents all DDS publishers providing flat-file data to via an SFTP push or pull (or via the DDS Uploader application in the case of TPP |
| SFTP Reader | Set of DDS applications that receives flat-file data, performs some initial processing (such as decryption) and posts the data into the Messaging API for onwards transformation. |
| MLLP Publishers | Represents the two DDS publishers sending HL7v2 ADT real-time messages via MLLP. |
| HL7 Receiver | DDS application that receives HL7v2 ADT messages over MLLP, performs some processing, and then posts those into the Messaging API for onwards transformation. |
| HL7v2 Rest Publishers | Represents the DDS publishers sending HL7v2 ADT and ORU real-time messages via a REST API. |
| HL7v2 Receiver | DDS application that receives HL7v2 ADT and ORU messages via REST, and then posts them into the Messaging API for onwards transformation. |
| Messaging API | API that acts as the gateway into the DDS transformation pipeline for all published data. |
| Inbound Transformation | Represents the set of Queue Reader applications used to transform raw published data into the standardised FHIR format and then store that in the core FHIR record databases. |
| Outbound Transformation | Represents the set of Queue Reader applications used to transform the FHIR data into the CSV for DDS subscriber databases. For internally hosted subscriber databases, the CSV data is written directly to them. For remotely hosted databases, the CSV data is written to a staging database for remote sending. |
| UPRN API | API used in the outbound transformation process to look up various attributes relating to addresses. |
| Information Model API | API used in the outbound transformation process to look up concept identifiers for various clinical coding schemes. |
| Remote Sending | Represents the process of writing the staged CSV data for remote subscriber databases (output of the outbound transformation process) to the DDS SFTP server, and that data then being collected by the Remote Filer application and applied to the remote subscriber databases. |
| National Reference Updates | Represents various processes run regularly (typically monthly or quarterly) to update DDS reference databases with new content from national sources, such as TRUD or ONS. |
| Local Code Updates | Represents processes run regularly (daily) to push new local codes received from EMIS and TPP into the Information Model. |
| Scheduled Report Extracts | Represents various clinical extracts generated from internal subscriber databases. |
| Frailty API | API provided to Adastra (via Redwood Technologies) to allow discovery of if a patient is considered “frail”. |
| Know Diabetes API | Feed to the Know Diabetes API, sending patient record updates to the remotely hosted API. |
| Clinical Dashboards | Represents the processing of data from the internal subscriber databases into the format used by the DDS clinical dashboards. |
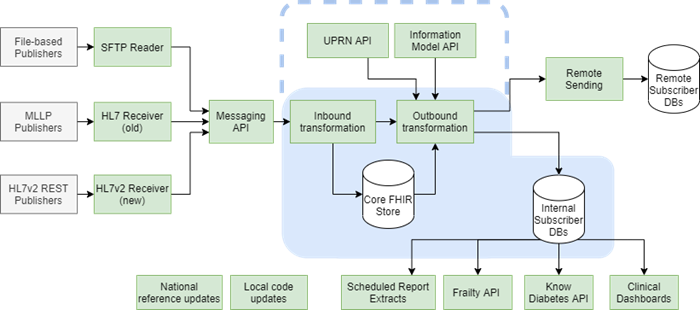
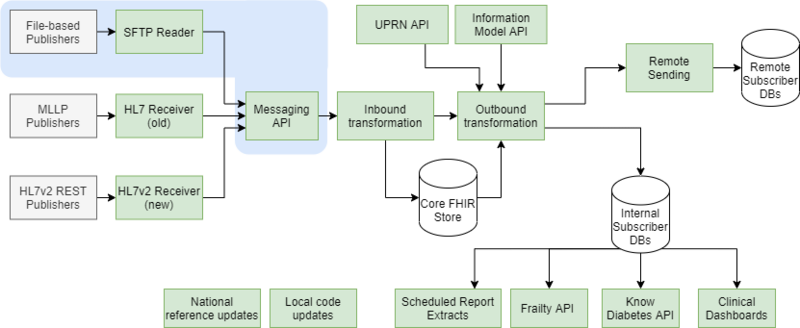
The following sections describe each dashboard, and provide a similar diagram, highlighting the components that the specific dashboard monitors.
Publishers
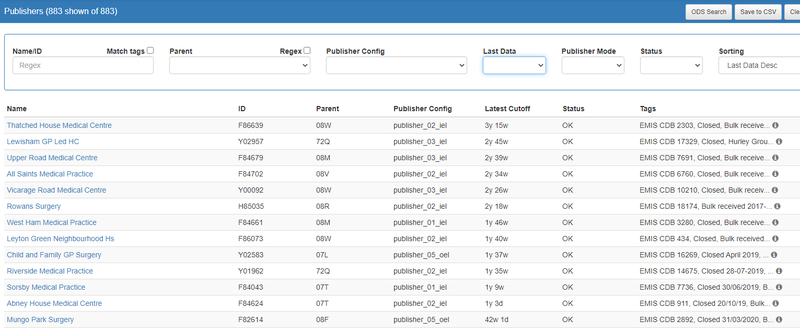
The Publishers page shows the current state of each discrete publishing service to DDS, irrespective of how their data is published. It shows details on when data was last published to DDS and the progress of the inbound transform (raw data to FHIR record store) for each one.
The primary use for this dashboard, from a monitoring perspective, is to detect services where no data has been received into DDS. The page is also used in the set up and configuration of DDS publishers, and controlling how published data is routed through the parallel processing queues.
Publisher Errors
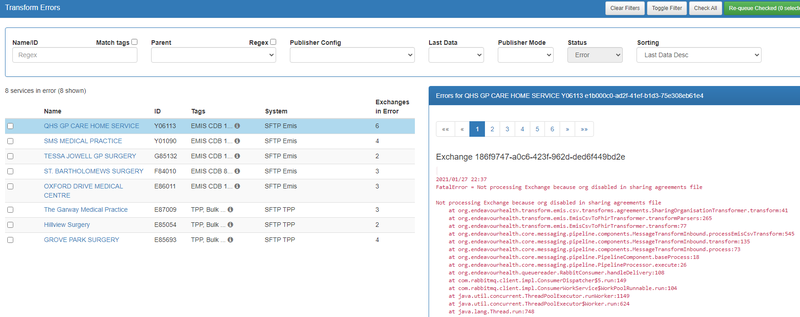
The Publisher Errors page displays details of any DDS publisher feeds where the inbound transform (raw data to FHIR record store) has encountered some kind of fatal error.
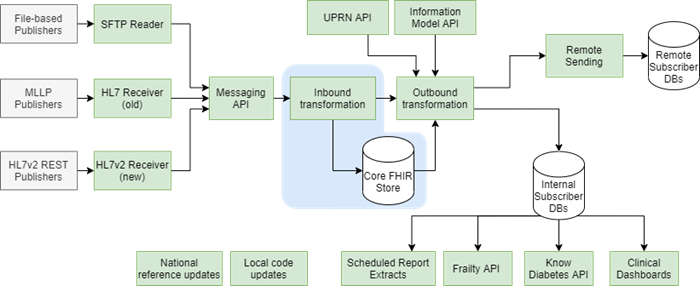
The primary purpose, from the monitoring perspective, is to display those services and provide a quick way to view the specific errors. The page also provides functionality for re-queueing data for inbound processing, once whatever issue has caused the error has been rectified.
Subscribers
The Subscribers page provides a summary view of both inbound (raw to FHIR store) and outbound (FHIR to subscriber CSV format) processing. Although it does not directly monitor the Information Model or UPRN APIs, these APIs are indirectly monitored due to the Queue Readers dependency on them – any issues with the API would be evident on this page.
Each separate subscriber feed is represented as a row, with various counts to show the progress/state of the published data for that subscriber. Any feed with publishers in error, or with significant delays in processing (either inbound or outbound) are highlighted with clear warning labels.
Clicking on a specific subscriber feed will display a detailed view, showing details about each publisher to that subscriber.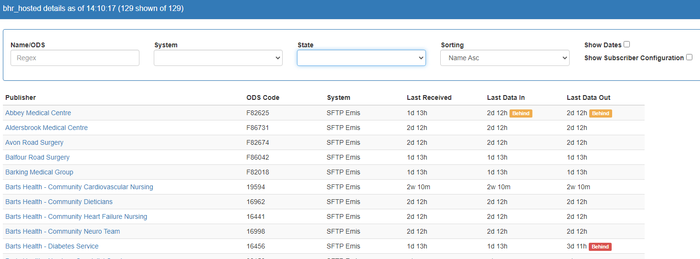
Queue Readers
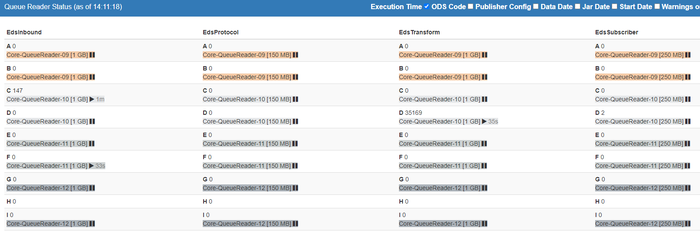
The Queue Readers page shows detail on the RabbitMQ queues and Queue Reader applications that are responsible for the inbound and outbound processing. Although it does not directly monitor the Information Model or UPRN APIs, these APIs are indirectly monitored due to the Queue Readers dependency on them – any issues with the API would be evident on this page.
Unlike the previous dashboards, this page is not oriented around DDS publishers or subscribers, but around the applications themselves. The page a grid of cells, with each cell representing a queue and Queue Reader application. The dashboard shows a clear warning if any queue is not being served by an application, for example if the application crashed or was not started, and also provides a view of current activity within the queues and Queue Readers.
Frailty API
The Frailty API page specifically displays running statistics on the DDS Frailty API. 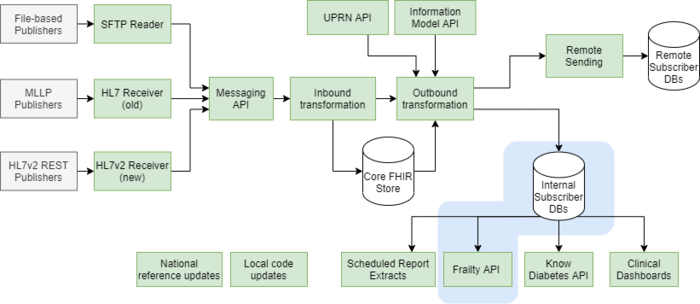
It shows a per-minute count of API calls and any errors that have happened. It also will highlight any sustained period of API inactivity since the API should always be called multiple times a minute.
HL7 Receiver
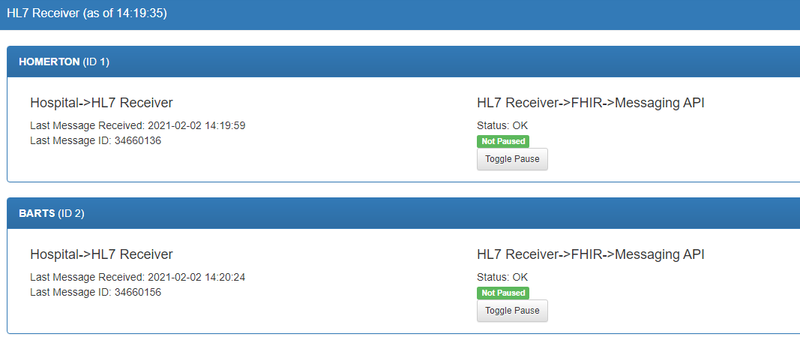
The HL7 Receiver page shows the status of HL7 Receiver application, which is responsible for receiving HL7v2 ADT messages over MLLP connections, then sending that received data into DDS.
The page shows each MLLP inbound feed as a separate horizontal record, and two columns within each record, showing:
- MLLP-to-HL7 Receiver status (left) – showing the timestamp of the last message received and highlighting if this was too long ago.
- HL7 Receiver-to-Messaging API status (right) – showing the status of received messages being sent into the DDS processing pipeline, via the Messaging API. It will highlight if there are any errors posting to the Messaging API and if there is a backlog of messages waiting to be posted.
In addition, this page has functionality to temporarily pause the posting of new HL7v2 messages into the Messaging API. This allows the HL7 Receiver application to continue receiving messages from hospital trusts but suspends the onwards processing. This feature may rarely be used when the Messaging API is under maintenance.
SFTP Reader
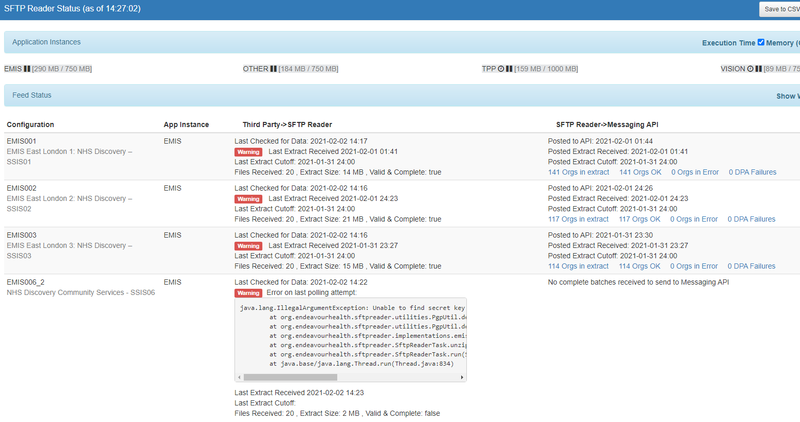
The SFTP Reader page displays the status of the SFTP Reader application, which is responsible for receiving all flat-file published data into DDS (most of which is via SFTP, but not all).
Each separate feed into the SFTP Reader application (which may contain data for up to fifty separate services) is displayed as a record on this page. For each feed, there are four columns displayed:
- The configuration name and human-readable description.
- The SFTP Reader application instance that this configuration is part of.
- The state of data being received from the publisher to the SFTP Reader. This will display when data was last received, show any errors in the receipt (e.g. failure to decrypted) and will highlight if no extract has been received in a suitable time.
- The state of received data being sent into the DDS processing pipeline via the Messaging API. This allows viewing of the individual publishing services, and highlights any errors such as missing Data Processing Agreements or failures in the Messaging API.
Scheduled Tasks
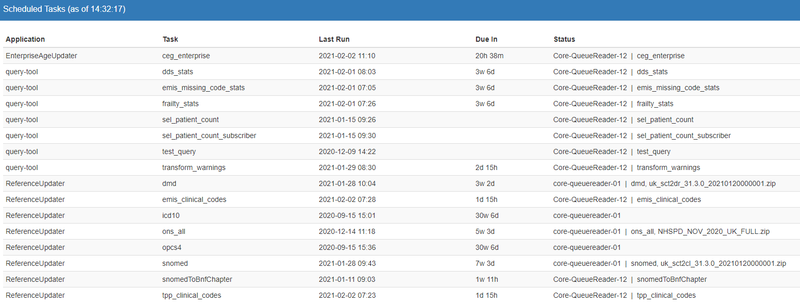
The Scheduled Tasks page is a general-purpose dashboard for monitoring any regular/repeating tasks or processes performed to support the DDS processing, but not directly part of the processing pipeline itself.
This page lists each task, when it was last performed, when it is next due, and will highlight any task not performed when it is due or that went into error when last performed. Examples of these tasks are the uploading of ONS postcode data into DDS, and copying of new TPP and EMIS local codes into the Information Model database.
Exceptions
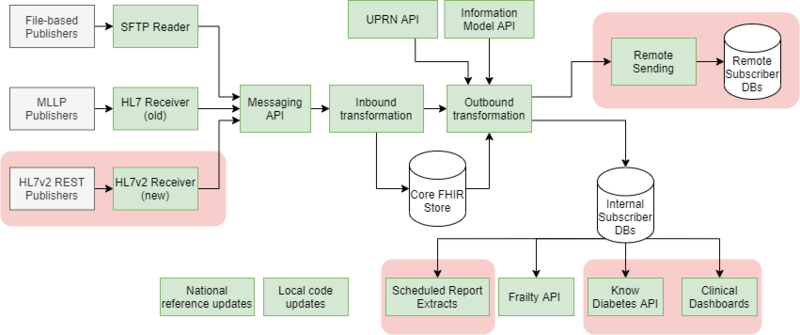
There are a number of aspects of the DDS pipeline that are not monitored with dashboards in the DDS-UI application.
These are:
- HL7v2 Receiver – this is the newer application built to receive HL7v2 messages, to provide a more scalable solution than the MLLP protocol used by the older HL7 Receiver application. Monitoring for this feed, based on the HL7 Receiver page, should be built in to DDS-UI.
- Remote Sending – for remote subscriber databases, the output of the outbound transformation process is a set of compressed CSV files intended for that remote database, stored in a database staging table. From this point, the data is copied to an SFTP server, before being collected by the Remote Filer applications and applied to the remote databases. These steps are not monitored via DDS-UI.
- Scheduled Report Extracts – there are a number of clinical reports run regularly on internal subscriber databases. These are currently monitored via Slack alerts (used to inform of both success and failure) and not DDS-UI. These tasks could also be monitored in DDS-UI via the Scheduled Tasks page.
- Know Diabetes API – the feed to the Know Diabetes API, generated daily from updates to a specific subscriber database, is not monitored via DDS-UI. This daily task could also be monitored in DDS-UI on the Scheduled Tasks page.
- Clinical Dashboards – the DDS clinical dashboards are generated daily from data in the internal subscriber databases. This process is not monitored via DDS-UI, but it could also be monitored in DDS-UI on the Scheduled Tasks page.
